
Audiogram Interpretation Explained: How to Read Your Hearing Test Results
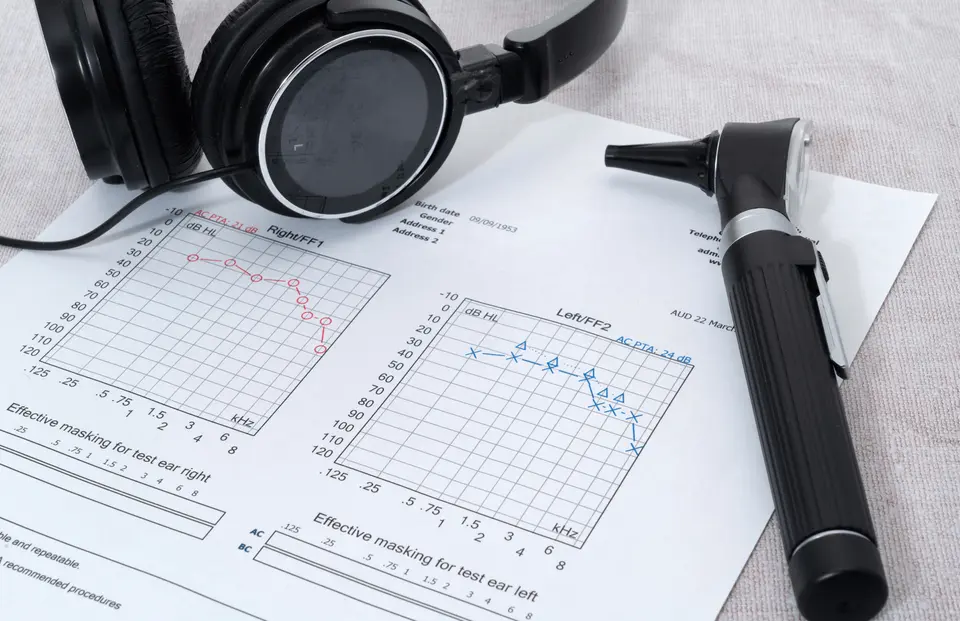
An audiogram is a visual chart that shows how well you hear different sound frequencies. It is the key output of a hearing test, providing essential information about your hearing thresholds. Interpreting an audiogram correctly matters because it helps identify the type and degree of hearing loss, which in turn guides the most appropriate management options.
Audiograms also help differentiate between conductive and sensorineural hearing loss by showing how air conduction and bone conduction results compare across frequencies. This distinction is important because each type has different underlying causes and treatments.
Your hearing care professional will always review your audiogram results with you after the test and guide you on the next steps. If you would like to understand the chart in more detail, this guide explains what the symbols mean, how it shows types of hearing loss, and how to interpret common patterns seen in audiograms.
What an Audiogram Measures
Source: Healthy Hearing
Audiometric testing measures how softly you can hear sounds at different pitches. These softest audible levels are called hearing thresholds, and they help determine whether your hearing falls within the normal range or shows signs of hearing loss.
On an audiogram, the horizontal x-axis represents pitch, ranging from low frequencies at 125 Hz to high frequencies at 8,000 Hz. The vertical y-axis represents loudness, measured from around -10 dB to 120 dB. Together, these axes show the exact frequencies and volumes where hearing may be reduced.
Many clinicians also refer to the “speech banana”, a curved region on the audiogram where most everyday speech sounds occur. This area illustrates why even mild changes in hearing sensitivity can affect how clearly you hear consonants and vowels in conversation.
How to Read and Interpret an Audiogram
Understanding an audiogram begins with the axes. The horizontal axis moves from low to high pitch as you read from left to right, while the vertical axis moves from soft to loud volume from top to bottom. Each point plotted on the chart represents the softest level of sound you can hear at a specific frequency, known as your hearing threshold.
These thresholds are plotted with different symbols for each ear and test method. Air conduction results, which measure how sound travels through the entire ear from the ear canal to the inner ear, are marked with O or △ for the right ear and X or ▢ for the left ear. Bone conduction results, which bypass the outer and middle ear to test the inner ear directly, are shown with symbols such as < and [ for the right ear and > and ] for the left ear.
Masking may be needed when there is a significant difference between ears. This is done to prevent sound from reaching the better ear and to ensure the results accurately reflect the hearing ability of the ear being tested.
What Are the Degrees of Hearing Loss on an Audiogram?
An audiogram helps determine how much sound input is required for you to detect different frequencies. The degree of hearing loss becomes clearer when the thresholds are interpreted systematically.
Normal hearing
Before classifying any degree of hearing loss, it is important to understand what normal hearing looks like on an audiogram. This provides a baseline for comparing thresholds and determining how far they deviate from the expected range. Generally, normal hearing thresholds fall above 25 decibels across all frequencies.
It is also important to remember that a normal audiogram does not rule out hidden hearing loss or auditory processing disorder. These conditions involve how the brain processes sound rather than how the ear detects it, so thresholds alone may appear normal even when listening difficulties are present. In these situations, additional assessments such as tympanometry and speech audiometry may be needed to provide a complete picture of hearing function.
Degrees of hearing loss
The vertical loudness scale shows how much volume is needed for a sound to be heard. As thresholds sit lower on this scale, the degree of hearing loss increases. Typical classifications include:
- Mild: 21 – 40 dB HL
- Moderate: 41 – 55 dB HL
- Moderately severe: 56 – 70 dB HL
- Severe: 71 – 90 dB HL
- Profound: 91 dB HL and above
Configuration of hearing loss
The overall pattern of the hearing loss can also be seen in the shape or configuration of the thresholds.
- Flat: Similar thresholds across pitches.
- Sloping: Greater difficulty in the high-pitched sounds.
- Rising: More difficulty in the low frequencies, with better hearing in the highs.
In addition, by examining the gap between the normal hearing region and the individual’s thresholds, it becomes easier to estimate how much environmental and speech information may be missed in everyday situations.
What Are Air-Bone Gaps in an Audiogram?
An air-bone gap is present when there is a difference of more than 10 dB between the air conduction and bone conduction thresholds for the same frequency. This gap indicates that sound is being reduced or blocked as it travels through the outer or middle ear.
When an air-bone gap appears on an audiogram, it suggests either conductive hearing loss or mixed hearing loss, depending on whether the bone conduction thresholds remain within the normal hearing range. Common causes of air-bone gaps include:
- Impacted earwax
- Eardrum perforation
- Fluid in the middle ear due to otitis media
- Problems with the ossicular chain, such as fixation or discontinuity
What Are Some Common Audiogram Patterns?
Audiograms tend to show recognisable patterns that offer clues about the underlying cause of hearing loss. By looking at how thresholds change across frequencies, hearing care professionals can identify whether the loss is age-related, noise-induced, or linked to issues in the outer, middle, or inner ear.
Normal hearing
Normal hearing shows thresholds above 20 to 25 dB with no air bone gap. This reflects healthy outer, middle and inner ear function.
Sensorineural hearing loss
Sensorineural hearing loss shows air and bone conduction symbols overlapping with reduced thresholds. This indicates inner ear or auditory nerve damage. In these cases, the air bone gap is typically less than 10dB.
Conductive hearing loss
Air bone gaps are present while bone conduction remains normal in conductive hearing loss. This points to outer or middle ear problems affecting sound transmission.
Presbycusis
Presbycusis displays a bilateral, symmetrical, high-frequency down-sloping pattern. This represents age-related degeneration of the cochlea.
Noise-induced hearing loss
With noise-induced hearing loss (NIHL), you may notice a distinct notch between 3–6 kHz, though it is most commonly seen at 4kHz. This pattern is a hallmark of acoustic trauma from loud noise exposure.
Ménière’s disease
Ménière’s disease presents with low-frequency sensorineural hearing loss. This reflects an inner ear fluid imbalance affecting hearing and balance.
Otosclerosis
Otosclerosis shows conductive hearing loss with a Carhart’s notch at 2 kHz. This indicates stapes fixation, reducing mechanical sound transfer.
Take a Hearing Test Today!
If you notice changes in your hearing or struggle to understand sounds clearly, book a hearing assessment to identify the cause and explore management options.
FAQs About Audiogram Interpretation
The sample audiograms you usually see online are simplified, but actual clinical audiograms include additional measurements, such as Speech Recognition Thresholds, Word Recognition Scores, Most Comfortable Levels, Uncomfortable Levels, and speech-in-noise tests.
These extra symbols offer a fuller picture of how you hear in real-world situations. After your appointment, your hearing centre should provide a full report. If your audiogram is not included, request a copy, as it serves as both your hearing prescription and an important baseline for tracking changes over time.

Megat witnessed the immense joy of those with hearing impairments when they were provided with hearing aids. Seeing how hearing-related services greatly enhance people’s quality of life further deepened his resolve to build a career in audiology.
Megat Ikmal
Clinical Audiologist
Schedule a Free Hearing Test
Required fields are marked.